
iconr package is hope to lay the foundation of further developments
Multifactorial analysis
In those examples, the study and comparisons have been made on the basis of different types of GUs with the variable type (nd.var = "type"). However, if a new column is added to the node dataframe or shapefile, the study can also incorporate other variables. Fox example, one of these new variable could be the technique by which the GU was created (nd.var = "technique"):

GIS view. The Brozas stelae (decoration 1) with the different engraving techniques: g_piq (peckings) for the spear, the shield and the sword; g_inc (incisions) for the the fibula and the comb
Shape analysis
When the decoration iconographical content is composed by GUs separated one with another with neutral background, is could be easy to binarize and polygonize them (black GUs on white background). GUs can also be binarized/polygonized separately and reintegrated to the GIS interface

GIS view. Graph decoration with shape analysis indexes (ConveHull, Minimum Bound Rectangle, Minimum Bound Circle)
Shape analysis allows to calculate numerous indexes (e.g., convexhull, MBR, MBC, Feret diameter) and/or contour comparisons (e.g., Procrustes analysis) that can be used in multivariate analysis to quantify the (dis)similarities between GUs
Typology
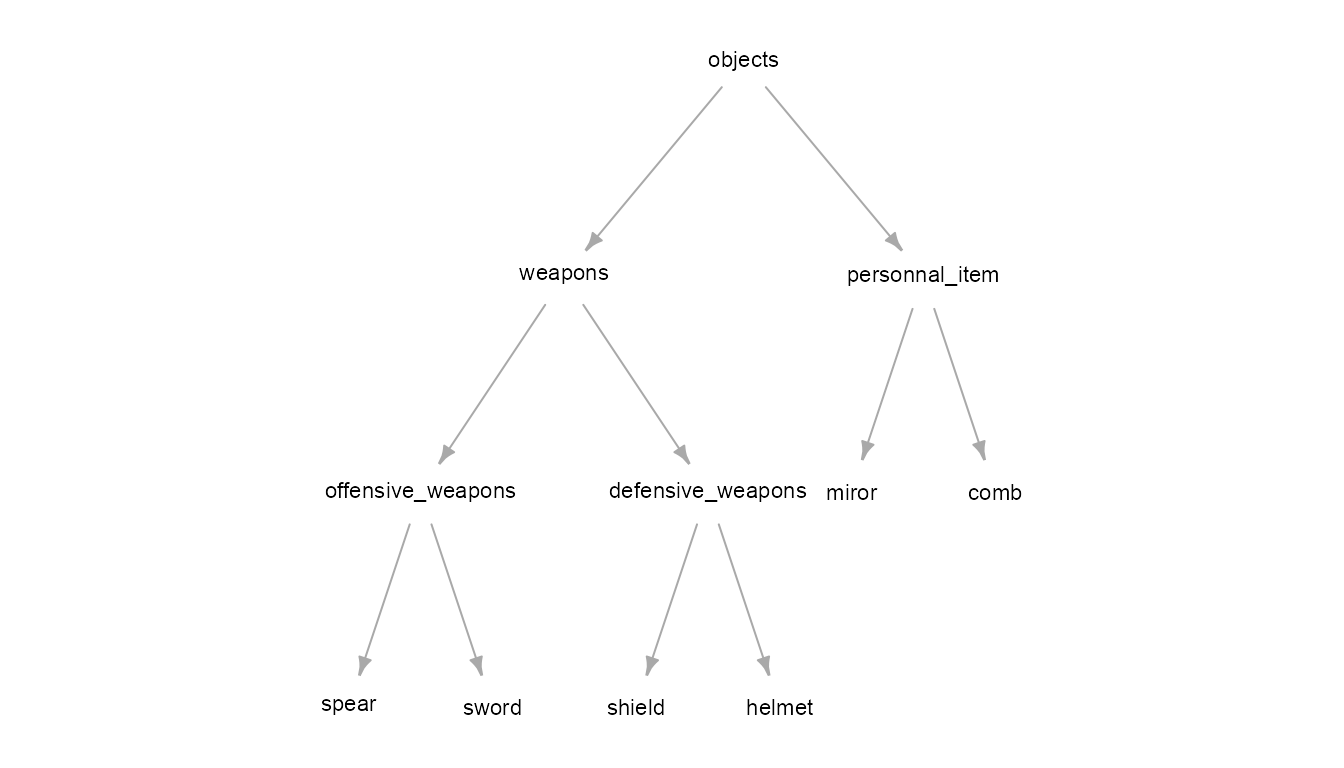
Graph theory and structured vocabularies allows one to construct tree structures for categorical variables (e.g., the different types of GUs). These structures allow generalization processes (upward to the parent level) and specification processes (downward to the child level). For example, a sword and a spear belong both to the weapons group (sub-group offensive weapons), a shield belongs to the weapons group (sub-group defensive weapons), etc.:
oldpar <- par(no.readonly = TRUE)
on.exit(par(oldpar))
par(mar=c(0, 0, 0, 0))
g <- graph_from_literal(objects-+weapons,
                        objects-+personnal_item,
                        weapons-+offensive_weapons,
                        weapons-+defensive_weapons,
                        offensive_weapons-+spear,
                        offensive_weapons-+sword,
                        defensive_weapons-+shield,
                        defensive_weapons-+helmet,
                        personnal_item-+miror,
                        personnal_item-+comb)
layout <- layout.reingold.tilford(g)
plot(g,
     layout = layout,
     vertex.color = "white",
     vertex.frame.color = "white",
     vertex.size = 20,
     vertex.label.cex = 0.7,
     vertex.label.color = "black",
     vertex.label.family = "sans",
     edge.arrow.size = 0.5
     )
Such a formalism can be used to weight the differences between nodes, to conduct analysis with different levels of precision or to overcome issues of idiosyncratic typologies.
A major issue will be to manage multi-linguism shared vocabularies to describe the iconographic content, the techniques used, etc.
Harris matrix
Using the diachronic edge notation, layered directed acyclic graphs (DAG) – like the Harris matrix relative chronology diagrams – can also be used to construct. For example, with the Ibahernando stelae (decoration 5)
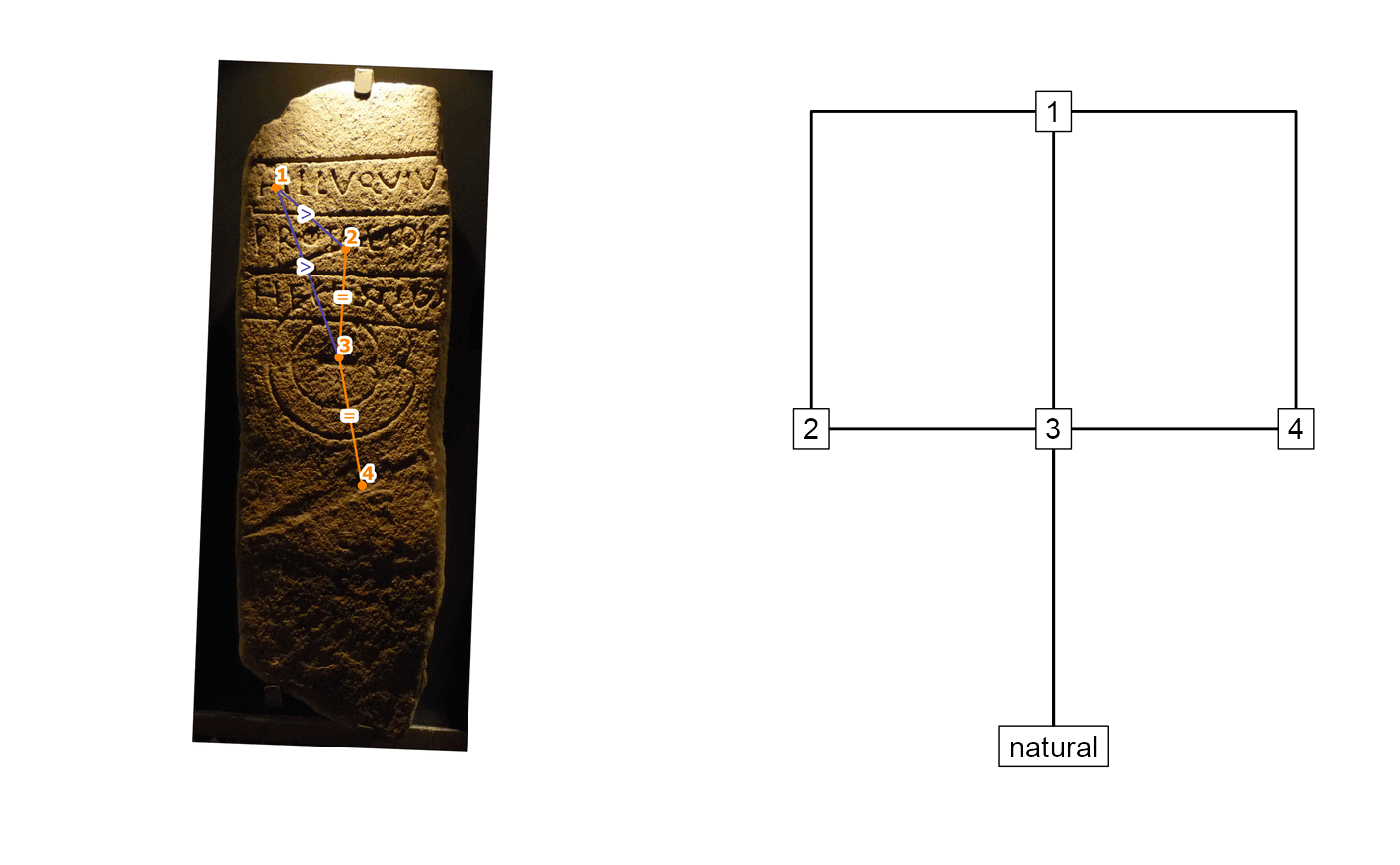
DAG is a common graphical formalism to represent chronological ordering such as Bayesian, radiocarbon and age-depth models (e.g., RChronoModel, stratigraphr). DAGs can also be used for cultural period sequences like GUs chrono-cultural attribution (e.g., “Late Bronze Age,” “Iron Age,” “Roman Times”)